Detroit Lions vs Baltimore Ravens Match Player Stats: The 2023 Blowout Broken Down Play by Play
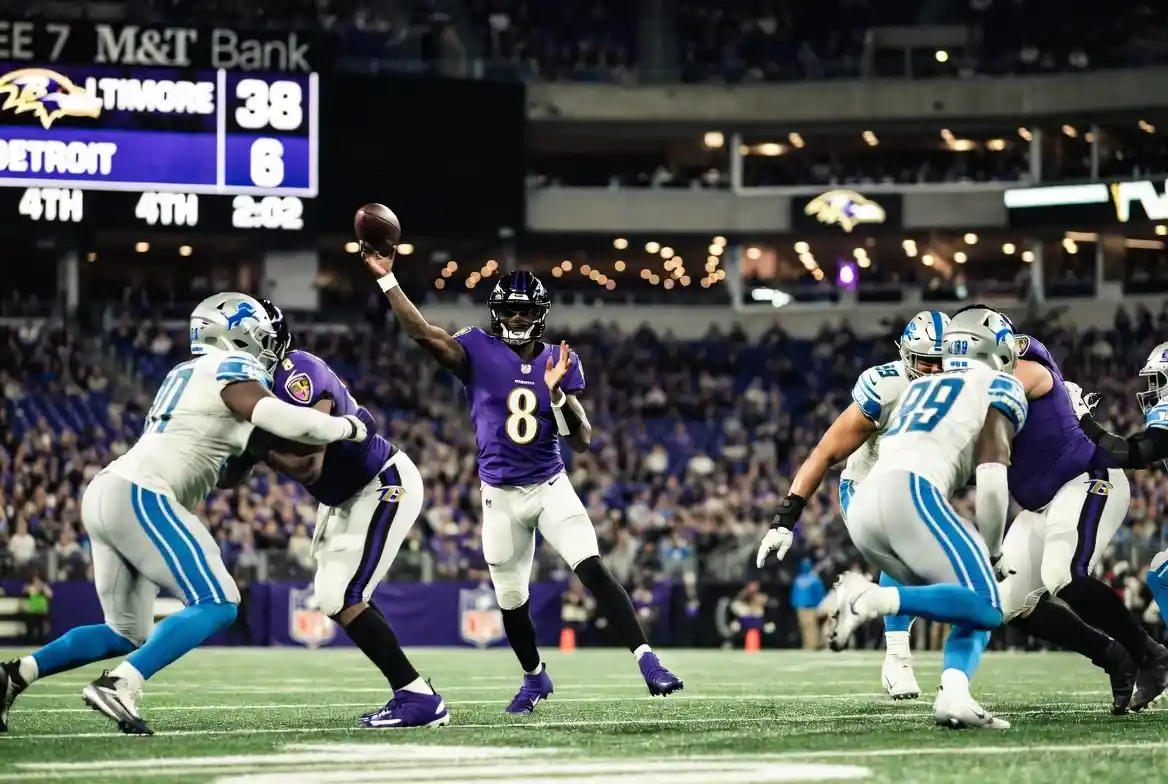
Problem: You looked at the final score, Baltimore 38, Detroit 6, and assumed you knew the story.
Agitate: That number hides which players dominated, where Detroit collapsed, and how Baltimore’s scheme dismantled a 5‑1 Lions team. Without the full Detroit Lions vs Baltimore Ravens match player stats, you only have half the picture.
Solve: This page gives you exactly that. Below you’ll find every meaningful passing, rushing, defensive, and situational stat from the October 22, 2023 game at M&T Bank Stadium, explained so clearly you’ll feel like you watched the All‑22 film yourself.
Game Overview: How the Ravens Stunned the Lions
The Detroit Lions arrived in Baltimore with a 5‑1 record and one of the league’s most balanced offenses. They left with a 38‑6 loss, dominated in every phase. Detroit’s offense didn’t find the end zone until garbage time. A direct look at the Detroit Lions vs Baltimore Ravens match player stats reveals a lopsided contest where Lamar Jackson played flawless football and Detroit’s normally reliable unit self-destructed.
- Final Score: Baltimore Ravens 38, Detroit Lions 6
- Location: M&T Bank Stadium, Baltimore, Maryland
- Game Time: 1:00 PM ET, Week 7, 2023 NFL season
- Weather: Sunny, 55°F, wind 10 mph
Quarter‑by‑Quarter Scoring Breakdown and Momentum Shifts
| Quarter | Detroit Lions | Baltimore Ravens | Key Play |
|---|---|---|---|
| 1st | 0 | 14 | Lamar Jackson 7‑yard TD run; Jackson 8‑yard TD pass to Nelson Agholor |
| 2nd | 0 | 14 | Jackson 12‑yard TD pass to Mark Andrews; Gus Edwards 1‑yard TD run |
| 3rd | 0 | 7 | Jackson 9‑yard TD pass to Andrews |
| 4th | 6 | 3 | Jahmyr Gibbs 21‑yard TD run; Justin Tucker 32‑yard FG |
The Ravens opened with a surgical 75‑yard drive capped by Jackson’s rushing score. By half-time, the game was essentially over: Baltimore led 28‑0, racking up 325 total yards to Detroit’s 68. The second half was damage control for the Lions, but the visitor never threatened.
Lamar Jackson’s Passing and Rushing Stats: A Day of Near Perfection
No single performer influenced the Detroit Lions vs Baltimore Ravens match player stats more than Lamar Jackson. He completed 21 of 27 passes for 357 yards and 3 touchdowns, posting a near‑perfect passer rating of 155.8. He added 36 rushing yards and a touchdown on 9 carries, extending plays and keeping drives alive.
- Passing line: 21/27, 357 yards, 3 TD, 0 INT, 155.8 rating
- Rushing line: 9 carries, 36 yards, 1 TD
- Total touchdowns responsible for: 4
- Yards per attempt: 13.2
- Deep completions: Multiple passes of 20+ yards to rookie Zay Flowers and tight end Mark Andrews
Jackson’s decision-making was elite. He targeted eight different receivers, avoided pressure, and threw into tight windows without risk. According to NFL Next Gen Stats, his avg time to throw was 2.87 seconds, yet he faced only two QB hits. The Lions’ pass rush never truly arrived.
Baltimore Ravens Offensive Player Stats: Receiving and Rushing Leaders
The Ravens’ skill players all contributed. Examining the Detroit Lions vs Baltimore Ravens match player stats reveals how balanced the attack was.
Ravens Receiving Stats
| Player | Receptions | Targets | Yards | TD | Long |
|---|---|---|---|---|---|
| Mark Andrews | 4 | 6 | 63 | 2 | 25 |
| Zay Flowers | 4 | 5 | 75 | 0 | 46 |
| Nelson Agholor | 3 | 3 | 42 | 1 | 20 |
| Odell Beckham Jr. | 3 | 4 | 34 | 0 | 20 |
| Justice Hill | 4 | 4 | 36 | 0 | 19 |
| Rashod Bateman | 2 | 3 | 38 | 0 | 22 |
| Others | 1 | 2 | 9 | 0 | 9 |
Mark Andrews caught both of his red-zone targets for touchdowns, exploiting Detroit’s linebackers in coverage. Rookie Zay Flowers kept the chains moving with a 46‑yard catch‑and‑run that set up an early score.
Ravens Rushing Stats
| Player | Carries | Yards | TD | Long |
|---|---|---|---|---|
| Gus Edwards | 14 | 64 | 1 | 27 |
| Justice Hill | 6 | 28 | 0 | 9 |
| Lamar Jackson | 9 | 36 | 1 | 7 |
| Melvin Gordon | 3 | 18 | 0 | 9 |
| Team Total | 32 | 146 | 2 | – |
Baltimore’s offensive line opened gaping holes. Gus Edwards averaged 4.6 yards per carry, often pushing the pile after contact. The rushing attack kept the Lions’ defense on the field for 37:42 of possession time.
Detroit Lions Offensive Player Stats: Where the Breakdown Happened
Detroit’s offense, which had averaged 28 points per game through Week 6, was unrecognisable. Jared Goff faced constant pressure and threw a costly interception. A close look at the Detroit Lions vs Baltimore Ravens match player stats shows why the Lions converted only 2 of 13 third downs.
Lions Passing Stats
| Player | Completions/Attempts | Yards | TD | INT | Sacks | Rating |
|---|---|---|---|---|---|---|
| Jared Goff | 33/53 | 284 | 0 | 1 | 5 | 66.5 |
| Jameson Williams | 0/1 | 0 | 0 | 0 | 0 | 39.6 |
Goff’s interception came on a tipped pass intended for Josh Reynolds, caught by Ravens safety Geno Stone. The quarterback was sacked five times and pressured on 40% of dropbacks. His 284 yards were mostly hollow, gained in predictable passing situations while trailing big.
Lions Receiving Stats
| Player | Receptions | Targets | Yards | TD | Long |
|---|---|---|---|---|---|
| Amon‑Ra St. Brown | 13 | 15 | 102 | 0 | 17 |
| Sam LaPorta | 6 | 10 | 48 | 0 | 15 |
| Kalif Raymond | 4 | 5 | 53 | 0 | 22 |
| Josh Reynolds | 3 | 8 | 27 | 0 | 13 |
| Jahmyr Gibbs | 4 | 5 | 24 | 0 | 10 |
| Jameson Williams | 0 | 3 | 0 | 0 | 0 |
Amon‑Ra St. Brown was the lone bright spot, catching 13 balls for 102 yards. However, his average catch depth was just 5.1 yards. Baltimore’s defense clogged the intermediate zones, forcing checkdowns. Rookie tight end Sam LaPorta saw 10 targets but managed only 48 yards, often smothered by linebacker Roquan Smith.
Lions Rushing Stats
| Player | Carries | Yards | TD | Long |
|---|---|---|---|---|
| Jahmyr Gibbs | 11 | 68 | 1 | 21 |
| David Montgomery | 6 | 8 | 0 | 4 |
| Jameson Williams | 1 | 0 | 0 | 0 |
| Team Total | 18 | 76 | 1 | – |
David Montgomery, Detroit’s power back, was held to a season‑low 8 yards on 6 carries. Jahmyr Gibbs’ late 21‑yard touchdown run came against backups and merely avoided a shutout.
Defensive Player Stats: Ravens’ Front Seven Dominates
The Detroit Lions vs Baltimore Ravens match player stats wouldn’t be complete without highlighting Baltimore’s destructive defense. The Ravens sacked Goff five times, forced one interception, and held Detroit to 2‑of‑13 on third down.
Baltimore Ravens Key Defensive Stats
| Player | Tackles (Solo) | Sacks | TFL | QB Hits | INT | PD |
|---|---|---|---|---|---|---|
| Roquan Smith | 6 (4) | 0 | 1 | 0 | 0 | 1 |
| Patrick Queen | 5 (3) | 0 | 0 | 1 | 0 | 0 |
| Kyle Van Noy | 4 (2) | 2.0 | 2 | 3 | 0 | 0 |
| Justin Madubuike | 3 (2) | 1.0 | 1 | 2 | 0 | 0 |
| Odafe Oweh | 2 (2) | 1.5 | 1 | 2 | 0 | 0 |
| Geno Stone | 3 (2) | 0 | 0 | 0 | 1 | 1 |
| Brandon Stephens | 5 (4) | 0 | 0 | 0 | 0 | 2 |
Veteran edge defender Kyle Van Noy registered two sacks and three quarterback hits in his first game with Baltimore. Geno Stone’s interception deep in Ravens territory killed any flicker of Detroit momentum in the second quarter. The pressure rate of 38.2% was the highest Goff had faced all season.
Detroit Lions Defensive Stats: Unable to Stop the Bleeding
Detroit’s defense, missing key starters in the secondary, couldn’t hold up. The unit allowed 503 total yards and recorded no sacks.
| Player | Tackles (Solo) | Sacks | TFL | QB Hits | INT | PD |
|---|---|---|---|---|---|---|
| Alex Anzalone | 10 (6) | 0 | 0 | 0 | 0 | 0 |
| Kerby Joseph | 8 (5) | 0 | 0 | 0 | 0 | 0 |
| Brian Branch | 7 (5) | 0 | 0 | 0 | 0 | 1 |
| Aidan Hutchinson | 3 (2) | 0 | 0 | 1 | 0 | 0 |
| Charles Harris | 2 (1) | 0 | 0 | 1 | 0 | 0 |
| Cameron Sutton | 4 (3) | 0 | 0 | 0 | 0 | 1 |
Aidan Hutchinson, Detroit’s premier pass rusher, was constantly double‑teamed and managed just one QB hit. The secondary allowed a season‑high 13.2 yards per completion. Missed tackles and coverage busts led directly to explosive plays.
Key Matchups That Shaped the Game
- Lamar Jackson vs Detroit’s linebacker coverage: The Lions used a lot of zone, but Jackson found Andrews and Flowers in the soft spots. Andrews’ two touchdowns came against linebackers forced into coverage.
- Roquan Smith vs Sam LaPorta: Baltimore’s All‑Pro linebacker limited the Lions’ rookie tight end to 6 harmless catches for 48 yards, eliminating Detroit’s third‑down safety valve.
- Ravens’ pass rush vs Detroit’s right tackle: Penei Sewell held his own, but the other side crumbled. Kyle Van Noy and Odafe Oweh repeatedly beat left tackle Taylor Decker, leading to four of the five sacks.
- Geno Stone vs Goff’s forced throw: Stone read Goff’s eyes perfectly on the interception, jumping a deep out route and giving the Ravens the ball back with a short field.
These individual battles directly fed the lopsided Detroit Lions vs Baltimore Ravens match player stats.
Turnovers, Special Teams, and Hidden Yardage
Turnovers and special teams often decide games, and here Baltimore won both phases. Detroit’s lone turnover was the Goff interception, while the Ravens committed zero. In the punting game, Baltimore’s Jordan Stout averaged 48.3 net yards per punt, pinning the Lions inside their own 20 twice. Detroit’s Jack Fox was solid but outkicked his coverage once, leading to a 38‑yard return by Devin Duvernay that set up a touchdown drive.
Third‑down efficiency was the hidden horror for Detroit. The Lions went 2‑for‑13; the Ravens converted 7‑of‑14. Time of possession (37:42 vs 22:18) swung heavily toward Baltimore, keeping Detroit’s offense on ice.
Coaching Decisions That Contributed to the Outcome
Dan Campbell admitted after the game that Baltimore “outcoached and outplayed” his team. Offensive coordinator Ben Johnson had no answer for Mike Macdonald’s simulated pressures. The Ravens showed blitz and dropped eight into coverage, confusing Goff repeatedly. Campbell’s decision to remain aggressive on fourth downs when trailing big felt more desperate than strategic, though the analytics favored it. Meanwhile, John Harbaugh’s staff stayed balanced, mixing runs and play‑action to keep the Lions’ defense guessing.
Historical Context and What This Game Means for the Lions‑Ravens Rivalry
This was only the seventh meeting between the franchises. Baltimore now leads the all‑time series 5‑2, and the 38‑6 result stands as the most one‑sided win in series history. For the Lions, it was a wakeup call that ended talk of an undefeated run and exposed weaknesses opponents would later exploit. For the Ravens, it cemented their status as a true Super Bowl threat, with Jackson playing at an MVP level.
Lessons Both Teams Can Take Away
- Detroit: Needs better interior offensive line depth and a more consistent pass rush beyond Hutchinson. The secondary must tighten up zone concepts against mobile QBs.
- Baltimore: If Jackson protects the ball and the defense creates pressure with four, this team can beat anyone. The wide receiver group led by Flowers and Agholor proved reliable.
Frequently Asked Questions
What were Lamar Jackson’s stats in the Detroit Lions vs Baltimore Ravens game?
Lamar Jackson completed 21 of 27 passes for 357 yards and 3 touchdowns, adding 36 rushing yards and 1 rushing TD. He posted a 155.8 passer rating and accounted for four total touchdowns.
Who scored the touchdowns for the Lions and Ravens?
Ravens touchdowns: Lamar Jackson (7‑yard run), Nelson Agholor (8‑yard pass), Mark Andrews twice (12 and 9‑yard passes), Gus Edwards (1‑yard run).
Lions touchdown: Jahmyr Gibbs (21‑yard run in the 4th quarter).
How many interceptions and turnovers were there?
Detroit committed one turnover — an interception thrown by Jared Goff, picked off by Geno Stone. Baltimore had zero turnovers.
What was the total yardage for each team?
Baltimore gained 503 total yards (357 passing, 146 rushing). Detroit managed 337 total yards (284 passing, 76 rushing).
Which defensive players recorded sacks?
The Ravens sacked Jared Goff five times. Kyle Van Noy had 2.0 sacks, Odafe Oweh 1.5, and Justin Madubuike 1.0. The Lions recorded zero sacks.
Why did Detroit lose so badly?
The Lions lost because of an ineffective offense (2‑of‑13 on third down), constant pressure on Goff (5 sacks, 1 INT), and a defense that couldn’t stop Lamar Jackson or create any negative plays. Baltimore dominated time of possession and explosive plays.
Bottom Line: Use These Player Stats to Understand True Team Strengths
Numbers tell the real story. The Detroit Lions vs Baltimore Ravens match player stats reveal a complete Baltimore masterclass and a Detroit team that wasn’t ready for the moment. Bookmark this page if you want one reference for every meaningful stat from that Week 7 blowout. When you re‑watch the tape, come back here to see how the data aligns with the film. Want more breakdowns like this? Share it with a football fan who obsesses over the details.